
What in-store collection at European scale produces, for whom, and the frameworks it is accountable to.
The European retail estate is about to operate the largest in-store product take-back programme in the region's history. The leading public case is textiles, where Directive (EU) 2025/1892 requires approximately 100,000 to 150,000 large-format apparel, footwear, and sportswear retail stores across the EU27 and EEA to operate Extended Producer Responsibility (EPR) funded take-back by 17 April 2028. Portable batteries are operational ahead of textiles under Regulation (EU) 2023/1542; small waste electrical and electronic equipment has been a retailer obligation since 2012. The structural argument is the same across all three. The infrastructure to receive returned product will exist by mandate. The infrastructure to produce structured data about each return will not, unless it is deliberately installed.
The financial materiality of these obligations is now CFO-legible. Textile EPR fees alone could add approximately 1.1 per cent to cost of goods sold and erode net profit by approximately 4 per cent for a large mass-fashion player by 2030 [61]. Carbon pricing now covers approximately 28 per cent of global emissions and is expanding scope. The same regulatory mechanism that creates this cost line is, structurally, the largest demand-creation event for SKU-resolution end-of-life data in the European retail sector. Brands that frame EPR as cost will pay it; brands that frame it as infrastructure will recoup it as marketing budget and risk reduction. The frameworks that consume this data, the Global Circularity Protocol (WBCSD/UNEP, COP30, November 2025), ESRS E5 under the Corporate Sustainability Reporting Directive, the GHG Protocol Scope 3 Category 12, the EU Taxonomy, SFDR Principal Adverse Impacts, the IMP 5+1 Dimensions, the GIIN Core Characteristics and IRIS+, CTI v4.0, and the EU Categorisation System, are developed in §10.
This paper sets out the impact thesis for that data infrastructure: the in-store collection programme operated as a four-stakeholder value layer, in which the same scan event produces measurable commercial value and sustainability impact for the customer, the retailer, the brand, and the recycler simultaneously, and produces attribution against every framework an informed impact investor will already recognise.
The argument proceeds as follows. The trajectory problem: EU separate collection of textile waste sat at 15.0% in 2022, having improved at 0.72 percentage points per year since 2016. Yield-side sustainability is necessary but not sufficient; volume-side sustainability is the harder question. The structural placement: the moment of consumer return is the only physical location in the system at which the data the downstream framework requires is co-located with the consumer whose action makes it accessible. The unit economics: every commercial interface in the European post-consumer textile chain is denominated in per kilogramme of material, and the customer-value line generated at the moment of return is structurally unowned by both the recycling industry and the retail marketing industry; capturing it converts the unit economics from per-kilogramme-of-material to unit-of-value-per-unit-of-material. The four-stakeholder value chain: each node captures both a commercial value and a sustainability impact from the same data event. The five revenue streams: one event produces five distinct commercial revenue lines and five distinct categories of impact attribution from the same metadata row. The eight-link theory of change: cohort structure, in-flight versus batch behaviour, store-level operational variance, incentive design, feedstock quality, recycler economics, net impact outcome, and the retailer-engagement flywheel. The indicator architecture: six metrics ranked by current verifiability, with the dependencies on the displacement factor named in line. The European-scale extrapolation: at the cohort-stratified European retail estate (approximately 173,500 stores across four operationally distinct cohorts) operating at full-category coverage and replacement-cycle maturity, approximately 390,000 tonnes of textile material diverted from disposal per year, approximately 2.73 million tonnes CO2e avoided per year (central estimate, displacement-factor range 1.95 to 3.90 million tonnes), approximately 469 million verified consumer-engagement events per year, contributing approximately 15 per cent of the gap between the current EU collection rate and the 2030 ambition, operating alongside continued growth in municipal, charity, and online collection channels. Low-high range across plausible behavioural-parameter variation: 82,000 to 1.37 million tonnes per year.
The net environmental benefit of circular business models, resale, repair, refurbishment, is conditional on displacement: the proportion of recycled or reused output that displaces virgin material in downstream consumption rather than supplementing it. The published literature places this parameter in a wide range that is wide enough to swing the impact of any circular business model between net-positive and net-negative [54]; [55]. The platform's data layer is the at-scale research instrument for resolving this question in European retail; the same data substrate the platform deploys for retailer, brand, and recycler value is the substrate any circular business model impact claim depends on for evidentiary defensibility.
The structural argument extends to other consumer product categories where producer responsibility plus retailer obligation is the legislative pattern: portable batteries, small WEEE, and the emerging Ecodesign for Sustainable Products Regulation delegated-act categories (mattresses, furniture, tyres). Each category carries category-specific impact vectors, most consequentially fire-safe routing for lithium-ion-containing categories, that the same data event addresses. §13 develops where the argument extends and where it does not.
The honest framing: not transformative at sector level, the first measurable contribution to closing the gap between the current trajectory and the EU's 2030 ambition, the only contribution that produces per-event evidence across all four converging frameworks at SKU resolution. The closing structural synthesis: three patterns that recur across the chain (an industry-side reading failure on the regulator's choice to engage retailers; customer engagement structurally absent from both the retail operating system and the recycling chain's profit and loss; and the binding constraint being not hardware but systemic integration) are themselves structurally linked, and change at one node is linked to change at the other two.
Four empirical questions remain open at the time of publication, and are presented as the platform's own research output: the displacement factor at retail scale; cohort-level attribution of participation beyond the prosocial baseline; store-level operational sensitivity, including the brand-mix hypothesis; and the drip-versus-batch sort-yield differential. Each is named in line at the point in the chain where it is binding. The paper closes with the honest treatment of what is currently shipping and what is roadmap. A formal third-party lifecycle assessment is scoped for completion in 2026 but is not yet in hand; the Product Journey Layer for downstream chain-of-custody is roadmap, not shipping; ISO 27001 certification is in initiation phase, not in hand.
The European textile collection system has been improving. Slowly.
In 2016, the EU separately collected 10.7% of its textile waste. By 2022, the figure had risen to 15.0% [1]. The improvement rate over that six-year window is 0.72 percentage points per year. The trajectory is positive. It is also, when projected forward at the same pace, inadequate to the policy ambition.
At 0.72 percentage points per year, the line crosses 50% in approximately 2071, and 80% in approximately 2113. The EU's stated 2030 ambition is 50%, with an aspirational upside of 80% [2]. The gap between the trajectory and the ambition is forty-one years for the central target and eighty-three years for the upside. Some part of this gap will close through the EPR-funded scale-up triggered by Directive (EU) 2025/1892, which enters force on 16 October 2025 and requires operational EPR schemes by 17 April 2028 [3]. Some part will not.
European textile waste runs to 6.94 million tonnes per year, or sixteen kilogrammes per person across the EU27 [1]. Around 85% of that volume, approximately 5.9 million tonnes, leaves the household via mixed municipal waste streams and is incinerated or landfilled. The remaining 15% enters the collection system. Of that 15%, communal collection programmes recover approximately 36% in sort yield [4]; the rest is lost again to sorting and processing inefficiencies. The aggregate fate of post-consumer textile waste in Europe today is approximately 94% incinerated or landfilled.
A consensus account of the cause locates the bottleneck downstream: insufficient sorting capacity, immature textile-to-textile recycling technology, an absence of profitable end markets for recovered fibre. Each of those factors is real. None of them is the binding constraint.
I spent the first eighteen months of Utilitarian assuming the binding constraint was downstream of the consumer return. We were building tooling for sorters and recyclers. The data we cared about was the material composition of what came out of the sort. Then I spent a year talking to recyclers. The constraint they kept describing was not the technology. It was the feedstock walking through their door uncharacterised. The technology existed. The capital to deploy it existed. What did not exist was the information layer in front of it.
The same diagnosis turns out to apply at every other point in the value chain. The retailer's compliance team cannot report at the product resolution that CSRD will require, because the take-back programme produces a kilogram figure at the loading dock rather than a per-product record at the counter. The brand cannot attribute end-of-life outcomes to its SKUs through the wholesale channel, because the wholesale channel is the half of its distribution where it has no customer-data relationship. The regulator cannot modulate EPR fees against the products that are returned, because no record exists at the point of return that resolves to the SKU. The customer cannot see where the product they brought back went next, because the system between the counter and the recycler does not produce that visibility.
The constraint is not collection infrastructure. It is the absence of an information layer at the moment of consumer return.
There is a distinction worth naming up front. Yield-side sustainability, whether the existing flow of product is recovered, sorted, and reprocessed at higher rates, is what the current trajectory measures and what most circular-economy commentary engages with. Volume-side sustainability, whether the volume of product placed on market is compatible with the system's processing and material-recovery capacity, is a different question that has been largely absent from industry framing. The Dutch Beleidsprogramma Circulair Textiel 2025-2030 explicitly targets a reduction in clothing purchases from approximately 50 to 35 items per person per year by 2030 [59]. The directive's eco-modulation requirement, which the Commission can use to disincentivise the lowest-durability segments of the placed-on-market mix, is the regulatory mechanism through which the volume-side question becomes operational [3]. The data substrate this paper develops captures evidence for both questions. Yield-side sustainability is necessary but not sufficient; volume-side sustainability is the harder question.
Directive (EU) 2025/1892, in force from 16 October 2025, makes textile and footwear EPR mandatory across all 27 Member States, with operational schemes required by 17 April 2028 [3]. The defined obligated party is the "producer", but the directive's definition of producer is constructed so that the obligation lands on the entity that places goods on a Member State market under its own name, brand or trademark, "irrespective of the selling technique used". In retailing language, that is the brand owner, the private-label retailer, and the distance seller; the definition also reaches online marketplaces and non-EU sellers placing product on the EU consumer market [5].
The choice of obligated party was not arithmetically the cheapest. The Commission's Impact Assessment, SWD(2023) 421, records that current Member State arrangements assign separate-collection responsibility variously to municipalities, commercial operators, or social-economy enterprises, and ranked the EPR-with-producer-financing option above municipal-led collection and above status-quo extension on the explicit logic that it internalises the cost of end-of-life in the entity placing product on the market [6]. The directive's eco-modulation requirement, which scales fees with durability, reparability, and recyclability of the product placed on the market, only operates if the obligated party is also the design-controlling party. Municipalities and charity collectors do not design product. Retailers and brand-owning retailers do, or commission it. The choice of obligated party is therefore consistent with a deliberate decision to engage the actor whose fee schedule reaches back into product specification, not the actor with the lowest collection-cost-per-tonne.
The industry's reading of that choice has been narrower. The joint FEAD, EuRIC Textiles and Decathlon position of November 2024 frames retailers and producers as actors to be coordinated to deliver flow into the recycling network rather than as co-designers of the operating model [7]. EURATEX, representing brand-owning retailers, has argued for harmonised EPR fees and treats the retailer as the obligated payer rather than as the operator [8]. Two organisations have read the choice differently: the Ellen MacArthur Foundation's 2024 work on EPR policy explicitly names brands, retailers and online marketplaces as the responsibility-bearing tier and argues that EPR must reach into design and business model [9]; and EuroCommerce, representing the retail and wholesale sector, treats its members as the design point of the system [10]. Outside those two, the recycling industry frames retailers as the financing line, and the rest of the sustainability industry frames them as the compliance perimeter.
The WEEE precedent is informative rather than predictive. WEEE Directive 2012/19/EU has obliged retailers above 400 m² to accept very small WEEE free of charge for thirteen years; the EU collection rate stood at 40.6% in 2022 against a 65% target [1]. The WEEE Forum's 2024 review concluded that the current methodology is "neither accurate nor achievable" and called for an "all actors" principle holding everybody in the value chain accountable. Whether textile EPR avoids the WEEE failure mode depends on whether the industry treats retailers as operators or as a financing line. That is the choice the current responses make visible.
The structural argument extends beyond textiles. Portable batteries have operated under Regulation (EU) 2023/1542 ahead of textiles, with retailer take-back obligations active since 18 August 2025 [60]. Small waste electrical and electronic equipment has been a retailer obligation under WEEE Directive 2012/19/EU since 2012 [1]. The deliberate-choice reading of the regulator's decision in textiles, that retailers were engaged because retailers are the actor whose fee schedule can reach back into product specification, applies in the same form across categories where producer responsibility plus retailer obligation is the legislative pattern. The directive's eco-modulation requirement is the regulatory mechanism that creates demand for SKU-resolution end-of-life data; without that data, the price signal does not function as designed at the product-design level. The financial materiality is now CFO-legible: textile EPR fees alone could add approximately 1.1 per cent to cost of goods sold and erode net profit by approximately 4 per cent for a large mass-fashion player by 2030 [61]. Carbon pricing now covers approximately 28 per cent of global emissions and is expanding scope. Brands that frame EPR as cost will pay it; brands that frame it as infrastructure will recoup it as marketing budget and risk reduction.
The directive sets the floor. The industry's reading does not yet build the ceiling. The operational layer between obligated party and recycler, the layer that produces the consumer-facing return flow, runs the data infrastructure that connects placement to recovery, and is accountable for the eco-modulation signal reaching back into product specification, is the layer this paper is about.
This paper sets out what installing that layer at scale would produce, for each of the four stakeholders whose data it serves, against each of the frameworks the regulators and the impact investors have converged on, and at the European deployment scale the 2028 EPR mandate is about to make compulsory.
The moment of consumer return is the structural locus of the impact thesis. It is the only physical location in the European textile value chain at which the data required by the recycler, the regulator, the brand, the retailer, and the consumer is naturally co-located with the consumer whose action makes that data accessible.
Two consequences follow. The first is that the data captured at this moment has unusual reach: every downstream actor in the chain has a use for some piece of it, and the use is materially different at each node. The second is that any platform that does not capture data at this moment captures less of it later, at higher cost, with worse fidelity, and against a smaller fraction of the population. The bin in the household is the structural enemy. By the time the consumer has decided to discard a product, the only system that retains a relationship with both the customer and the product is the retail counter.
Under the EU Categorisation System for the Circular Economy, the platform sits in two adjacent positions.
Category 3. Re-use and value recovery. The verbatim named sub-category is Traceability platforms. The category describes systems that produce structured records of value-recovery events such that downstream operators can identify, sort, and process material on the basis of those records. The platform's primary commercial product is a traceability platform of this kind.
Category 4. Enabling Technologies. Category 4 describes the technical layer that makes circular activity in the other three categories operationally feasible at scale. Take-back-counter data capture, AI product identification at the point of return, and the integration layer that delivers that data into a retailer's existing CRM and into the recycler's existing sort line are enabling technologies in the verbatim sense Category 4 names.
The dual placement is not coincidental. A traceability platform that does not run on enabling-technology rails does not deploy across 100,000 retail stores. An enabling-technology layer without a traceability product does not produce the structured records the downstream frameworks consume. The platform is built to occupy both positions because the impact thesis requires both.
If the per-product, per-customer record at the moment of return is valuable to retailers, brands, recyclers, and regulators, the next question to ask is what the hardware to capture it actually costs.
A previous account of this cost anchored on industrial sortation equipment: fixed Tomra-class near-infrared lines at €250,000 to €450,000, fixed UHF RFID portals at €15,000 to €25,000, sensored deposit bins. That stack is real, and it is what a textile reprocessor or a regional collection consolidator would specify. It is not what an apparel, footwear, or sportswear retailer would install behind a shop counter to record which customer returned which garment. The realistic in-store envelope is roughly an order of magnitude lower.
Item-level UHF RFID is now the dominant inventory technology in apparel; per-store handheld readers, not fixed portals, are the realistic in-store envelope. Street prices through Zebra, TSL/HID Global, and Honeywell sit between €1,500 and €3,000 per unit at single-unit retail [11]; [12]. A retailer specifying one handheld per store would book between €1,500 and €3,000 of reader capex per location.
NFC is the more interesting category. NFC is now native to essentially every smartphone shipped in the last decade. Apple has supported NFC tag reading since the iPhone 7 in 2016, opened background tag reading in iOS 14 in 2020, and was obliged in 2024 to expose Host Card Emulation under European Commission antitrust action [13]; [14]. Android shipped NFC in volume from 2011 onward via Host Card Emulation on KitKat. By Q4 2023, around 94 per cent of smartphones in circulation globally carried an NFC controller [15]. The marginal hardware cost of a smartphone-based NFC read is zero when the device is already in hand.
Tags applied at manufacture run €0.04 to €0.10 per garment on volume, and the cost is borne upstream by the brand or producer, not by the retailer's hardware capex line [16]. Optional handheld near-infrared fibre verification adds €5,000 to €15,000 per unit including the first-year licence, where in-store composition verification is required [17].
Year-one capex for a basic in-store identification stack therefore lands at approximately €3,000 to €5,000 per store. With handheld near-infrared added for fibre verification, the figure rises to approximately €13,000 to €19,000 per store.
The asymmetry is what the question turns on. Per-store hardware capex of €3,000 to €5,000 sits against a per-facility MRF capex of €15 million to €40 million (developed in §3.4 and §4.4 below): two to three orders of magnitude. If the value of the data is established at the retail counter and the components of the capture stack are commodity, off-the-shelf, and largely already present in the retail estate, the question worth asking is why the European retail estate has not deployed per-product, per-customer end-of-life data capture at scale. The answer is not the hardware. §12 returns to it.
Every commercial interface in the European post-consumer textile chain is denominated in per kilogramme of material. Sorters bid per tonne. Recyclers contract per tonne. Producer Responsibility Organisations subsidise per tonne. Mechanical and chemical recyclers sign offtake agreements indexed to per-tonne feedstock specifications, with bonus and malus clauses against composition and contamination thresholds [18]. The chain's accounting frame, end-to-end, is mass.
This section sets out what follows when the only unit of account is mass, and what changes when a second unit of account becomes available at the moment of consumer return.
The 2022 Sorting for Circularity Europe baseline measured the gap between the cost of producing recycling-grade feedstock and the price at which a mechanical or chemical recycler would buy it at roughly €150 to €200 per tonne. The 2024 update widened the gap as the rewearable export market to North Africa and Sub-Saharan Africa collapsed under second-hand saturation and import frictions [18]. Refashion's 2023 disclosures show the French PRO paying out roughly €100 per tonne in operator support, with sorters reporting operating margins near zero once subsidy is netted out [19].
Three structural observations follow. Every line item in the chain's profit and loss is indexed to mass. The commodity reference, per-tonne fibre price, is the only reference the chain uses to value its own output. And when material prices fall, the entire chain becomes loss-making at the operator level, because no other revenue line exists to absorb the shock.
In retail marketing, the cost of acquiring a permissioned customer record is a well-documented line. The DMA UK Marketer Email Tracker 2023 reports a median return of £36 per £1 spent on email, with acquisition cost per consented email running between £1 and £5 depending on channel [20]. Klaviyo's 2024 benchmarks place median paid-social cost per email between US$2.50 and US$6.00 for apparel brands; in-store capture at a point-of-sale terminal lands between €1 and €3 per consented email, the lower figure reflecting the fact that the customer is already present, transacting, and identifiable [21]. Litmus puts average email programme return on investment at roughly 36 to 1 for retail, with the consented address itself being the scarce asset [22].
Gartner's 2023 CMO Spend Survey identifies first-party data acquisition as the single highest-priority capability investment for retail CMOs in response to third-party cookie deprecation [23]. Forrester's 2024 State of Retail Marketing names "zero-party data capture in physical stores" as a top-three investment area. Forrester's list of capture channels does not include take-back, return, or recycling [24]. The eMarketer 2024 retail data-spend forecast counts in-store kiosks, loyalty programmes, app installs, receipt-based opt-in, and QR-coded packaging, but does not list take-back among acquisition channels [25].
The retail marketing industry prices a permissioned customer email at €1 to €5, treats first-party data as its scarcest input, and has not categorised the take-back moment as one of the locations where that input becomes available.
The symmetric absence is on the recycler side. Refashion's 2023 annual report breaks down revenue into eco-modulated producer contributions, sorting support payments, R&D fund disbursements, and operator subsidies. Consumer-engagement revenue does not appear. I:CO and SOEX, the largest operators of branded retail take-back in Europe, report throughput in tonnes and grading fractions; their public material does not disclose customer-data revenue lines [26]. The FEAD 2023 textiles report and the JRC's 2021 circular-economy perspectives on textiles both organise the chain around per-tonne flows and per-tonne costs. Neither lists customer attention, consent, or first-party data among the value lines [27]; [28].
This is the unowned line. The recycling industry has not categorised the customer at the moment of return as anything other than a delivery mechanism for material. The customer-value line therefore exists nowhere in the chain's accounting. It is not lost. It is unrecognised. That distinction matters: a value line that has been recognised and lost can be recovered through better commercial design; a value line that has not been categorised by either of the two industries that would naturally own it remains structurally unowned until a third actor builds the layer that captures it.
The European materials recovery facility for textiles has become a capital-intensive plant. The 2022 ReHubs baseline costed an automated sorting line at €15 million to €30 million, integrating near-infrared spectroscopy, hyperspectral imaging, robotic picking, and AI-based composition recognition, with throughput in the range of 25,000 to 50,000 tonnes per year. Tomra's published material on Valvan-Tomra and Project Refiber places unit cost per tonne on the automated line at roughly €120 to €180, against a manual sort cost of €250 to €400 per tonne [29].
The capex is, structurally, the price paid downstream for not knowing upstream. Every near-infrared scan at the MRF is a re-identification of a garment whose composition was declared by the producer at the point of placing-on-market, then lost during use and disposal. The JRC's 2024 work on the Digital Product Passport names this directly: if composition travels with the garment, the sort line collapses from a re-identification machine into a routing machine [30]. Refashion's 2024 sorting-facility cost analysis estimates that 15 to 25 per cent of MRF operating cost is directly attributable to compositional uncertainty at intake.
§4.4 returns to this point in the context of the recycler's specific value position; the broader observation here is that the chain has been paying, in capex, for the information it did not capture at the point of consumer return.
Lay the three figures next to each other. A tonne of mixed post-consumer textile sells, after sorting, for between €0 and €400 depending on fraction, with the median European sorter losing money on the marginal tonne. A single permissioned customer email is worth €1 to €5 in acquisition-cost terms, and considerably more in downstream lifetime value: Klaviyo's median apparel customer-lifetime-value per consented contact runs into the hundreds of euros. A garment weighs roughly 0.3 to 0.5 kilogrammes.
A typical store-level take-back event therefore delivers, in customer-value terms, an asset of one to two orders of magnitude higher value than the material it accompanies, at the moment the customer hands the garment over.
The data layer captures this customer value at marginal cost. Identification at the moment of return generates a consented record, an attention event (the visit to the store), and a behavioural signal (brand, category, frequency, volume). None of these are currently priced into any contract in the recycling chain. All of them are routinely priced in retail marketing. The arbitrage is not a marketing trick. It is the mechanical consequence of two industries having drawn their commercial boundaries such that the customer-value line at the take-back moment falls between them.
The chain has been organised, from collection through sorting to recycler offtake, around per-kilogramme material value. Every contract, every gate fee, every PRO subsidy line, every MRF capital case is denominated in mass. The customer-value line generated at the moment of consumer return is structurally absent from recycler accounting and structurally uncategorised in retail marketing surveys. It is the largest unowned line in the chain.
Capturing it converts the unit economics from per-kilogramme-of-material to unit-of-value-per-unit-of-material, where the unit-of-value is a permissioned, identified, behaviourally signalled customer interaction whose published benchmark price already exceeds the per-kilogramme bale price by one to two orders of magnitude. This is the structural shift the data layer enables. It is the reason the chain's economics change shape, rather than merely improving, when identification moves to the moment of return.
§4 follows the consequence of this shift through the four stakeholders, each of whose unit economics change when the customer-value line is captured rather than left unowned. §6 examines the eight links of the theory of change that connect the moment of capture to the net impact outcome at scale. §12 returns, in the closing structural synthesis, to the question this section leaves open: if the customer-value line is this large and the cost of capturing it is this small, why has the European retail estate not built the layer that captures it?
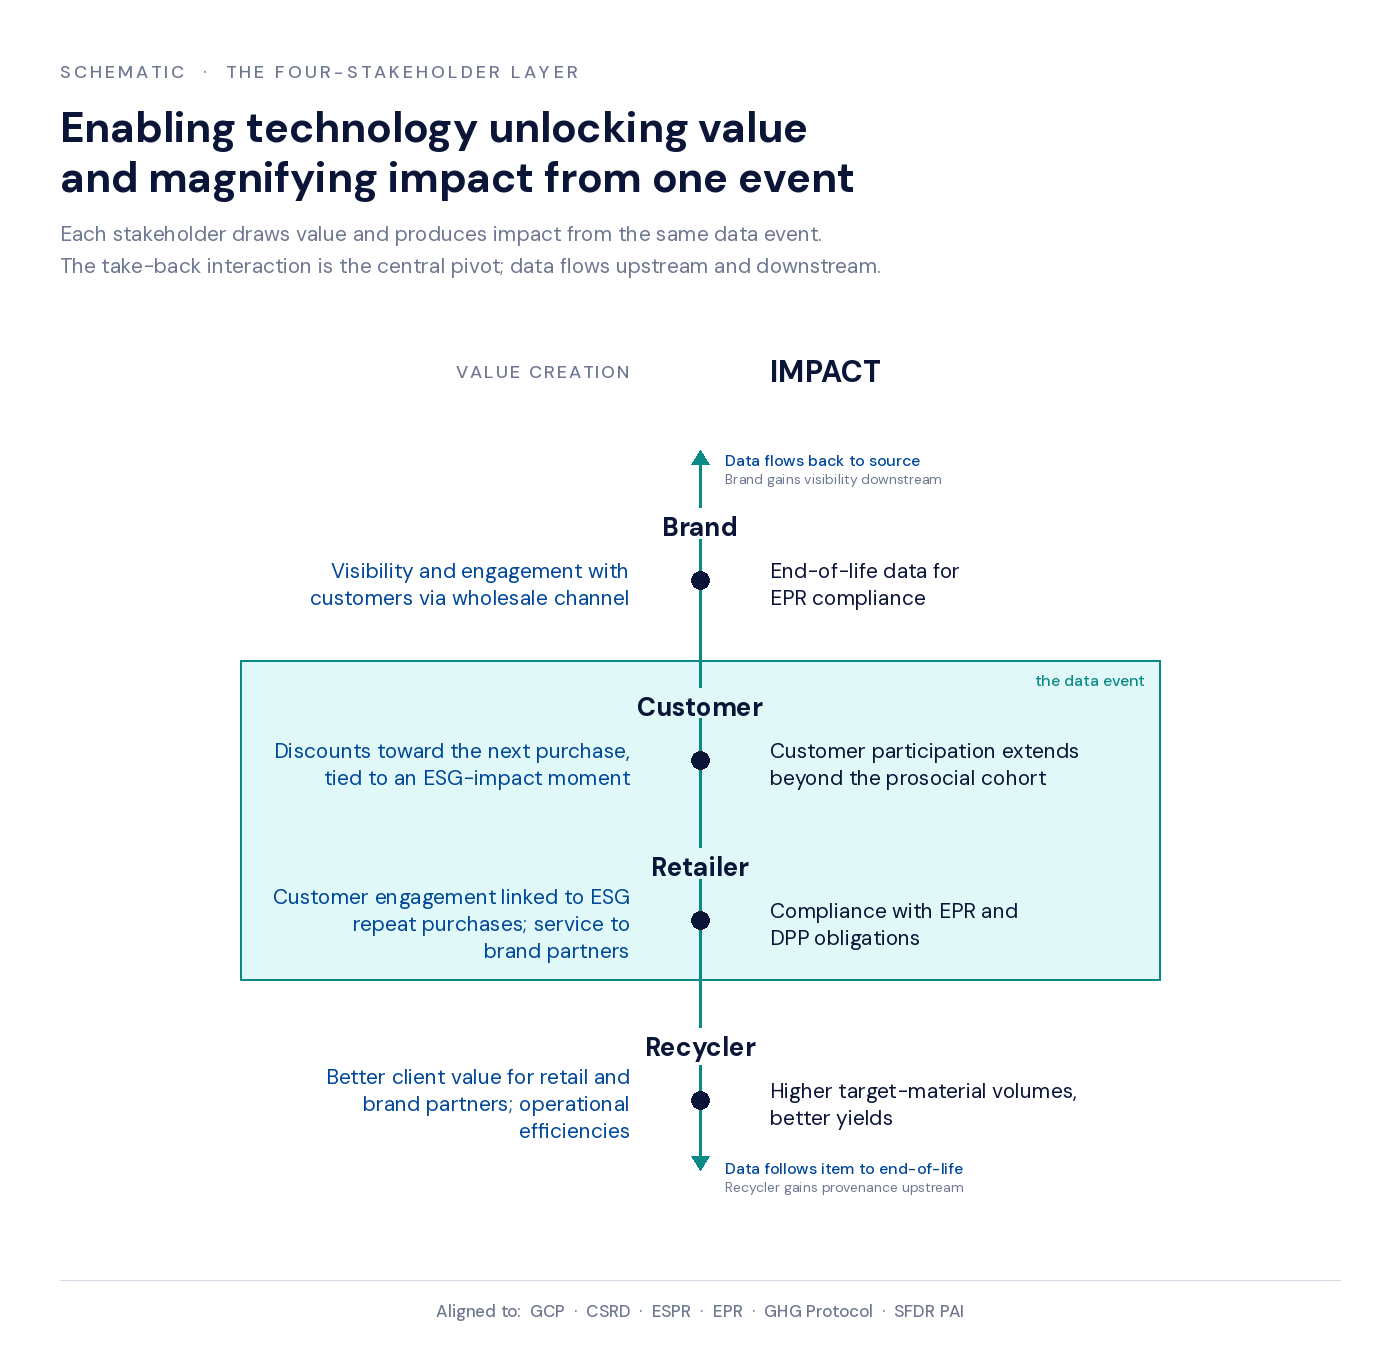
The four-stakeholder framing is the structural spine of the impact thesis. Each node in the chain (customer, retailer, brand, recycler) captures both a sustainability impact and a commercial value from the same data event, and resolves a specific failure mode that the existing batch-collection model produces by design. The chain is presented in customer-first reading order; the data flow runs in the same direction.
Role: the person whose action makes the data accessible. Without the customer's participation, the chain does not begin.
Sustainability impact for the customer. Frictionless participation in circularity at the moment of replacement purchase. The cognitive cost of the existing batch-collection model (accumulate, find a charity bin, make a separate trip) is replaced by a drip-style alternative: bring the product back when you next come to the store. The new model uses a moment in the consumer's purchasing cycle that is already happening for a different reason.
Commercial value for the customer. An immediate reward (a store credit or discount, redeemable on the replacement purchase). Transparency about where the returned product goes next. A route to disposal that is simpler than every alternative the consumer has access to today.
The failure mode this resolves. The behavioural literature on prosocial participation identifies three cohorts in roughly stable ratios: a prosocial baseline of approximately 18%, a middle cohort of approximately 50% whose participation is contingent on the action being easy and visible, and an indifferent cohort of approximately 32% [1]; replicated empirically in the companion paper [2]. The existing batch-collection model serves the prosocial baseline well, the middle cohort only when the trip happens to be convenient, and the indifferent cohort not at all. The drip model converts the consumer ask from "accumulate then dispose" to "bring it back when you next come in": different cognitive load, different participation curve, different cohort recruitment [31].
Role: the operator of the physical point of consumer return. The retailer is the actor whose budget pays for the deployment, and whose operating system the deployment has to fit.
The European apparel, footwear, and sportswear store is engineered to convert square metres into transactions at a defined gross-margin yield, against a labour budget set by sales forecast. Read as an operating system, it exposes five binding constraints: thin operating margin, a fully allocated labour envelope, footprint costed at sales-productivity rates, working capital disciplined by inventory turn, and a bounded staff-attention budget that is a separate input from labour hours. Conventional take-back, with back-of-house bins, manual sorting, weight-based reporting, and parallel reverse logistics, imposes inputs the system was not specified to absorb. The retailer's resistance to accommodating it has been read in the industry literature as a sustainability-attitude problem. The evidence describes a binding-constraint problem.
Margins. European specialist retailers operate on net margins that do not absorb new fixed cost lightly. H&M Group reported operating margins of 3.7 per cent in FY2023 and 6.2 per cent in FY2024 [32]. Inditex, the most profitable European apparel operator at scale, reported 19.2 per cent on FY2024 sales of €38.6 billion [33]. The Deloitte Global Powers of Retailing 2024 benchmarks the apparel composite at a 6.5 per cent net profit margin, materially below food and discount retail [34]. Every euro of non-revenue-producing in-store activity is priced against a margin envelope that, outside Inditex, is single-digit.
Labour. Store-level wages run 10 to 17 per cent of net sales in specialty retail [35]. Between 65 and 75 per cent of front-line associate time is committed to scheduled tasks: replenishment, customer service, transactions, fitting room recovery, opening and closing. Discretionary capacity sits below 15 per cent [36]. Take-back retrofitted into this envelope lands as unscheduled task time: customer hand-off, garment inspection, sorting, logging, storage placement.
Footprint. Prime European high-street retail rents run from €4,000 per square metre per year in secondary high streets to over €20,000 on flagship streets in Milan and Paris [37]. Back-of-house allocation is typically 15 to 22 per cent of gross internal area for fashion specialty, with cost per square metre identical to selling-floor cost since leases price gross internal area, not function [38]. Storing returned garments on this footprint against zero direct revenue is a substitution cost that conventional take-back does not capitalise.
Inventory turn. Apparel retailers run inventory turn in the 3.2 to 4.4 times range at scale [32]; [33]. Returned garments held for periodic reverse-logistics pickup function, on the balance sheet, as inventory that cannot be sold and cannot be written off until disposition. They consume the same days-of-inventory line as sellable stock without contributing to turn.
Attention. Behavioural-operations research treats attention as a non-fungible input. Adding non-selling tasks to front-line associates produces statistically significant declines in conversion rate and basket size, with the effect concentrated at peak hours when attention is most constrained [39]. Take-back as conventionally designed lands at the till and the fitting room: the two highest-attention nodes in the store.
The failure modes are documented. The H&M Garment Collecting programme was operated through I:CO, a subsidiary of SOEX Group; SOEX Textil-Vermarktungsgesellschaft mbH filed for insolvency in October 2024, triggering a halt to collection volumes from H&M and partner retailers across European markets [40]. The single-processor dependency is the proximate illustration. Changing Markets Foundation's 2023 audit of in-store take-back schemes traced bin contents from ten European retailers and found 25 of 27 sampled garments exported, downcycled, or destroyed, with end-of-life destinations including landfill in Ghana and Romania [41]. Greenpeace Germany's 2022 follow-up placed 29 GPS-tagged garments at high-street take-back points; 24 left the EU within 90 days and 16 were tracked to municipal waste in destination countries [42]. Decathlon restructured its in-store buy-back from 2020 around dedicated second-life corners and digital pre-qualification following operational difficulty integrating walk-in deposits with standard store flow; North Face Renewed transitioned from in-store back-of-house collection to mail-in and dedicated processing in 2022 [43]. Across the catalogue, the failure is operational, not motivational.
The test any take-back model must pass to deploy at retail scale follows from the constraints, not from an external standard. It must not add unscheduled associate time at the till or fitting room. It must not occupy back-of-house footprint at sales-productivity rates. It must not place non-sellable inventory on the retailer's balance sheet. It must not depend on a single downstream processor for continuity of operation. A model that fails any one of the four conditions is asking the store to reshape its operating system. A model that satisfies all four is one the store can absorb without re-specification.
Sustainability impact for the retailer. Per-product end-of-life records exportable as evidence for CSRD Scope 3 Category 12 [44]. EPR fee-modulation evidence under Directive (EU) 2025/1892. Digital Product Passport end-of-life event records under the Ecodesign for Sustainable Products Regulation, in force since 18 July 2024, with the textile delegated act expected in 2027 [45].
Commercial value for the retailer. Verified customer email captured at €1–3 per address, against benchmarks of €12–25 across paid social acquisition and €18–31 across on-site popups [46]; [47]; [48]. Approximately 27% of email-captured scans come from repeat customers, on operational data from August 2025 through 9 May 2026 across the Dutch retail deployment [2]. A transparency-premium lift in purchase probability of 6 to 46 per cent from disclosing the supply-chain step at the moment of consumer interaction [49].
A model that satisfies the four-part test, and produces a verified email plus an in-store visit plus a structured replacement-consideration window from each scan event, is no longer a compliance cost line. It is the cheapest verified email a physical retailer can buy, and the cost is already provisioned in the EPR and CSRD budget. The compliance budget is converted into a marketing acquisition budget without new spend. The order matters. The operating-system test comes first; the cost-line conversion follows from passing it.
Role: the manufacturer whose product is being returned. The brand is the actor with no direct relationship to the customer in the wholesale half of its distribution.
Sustainability impact for the brand. SKU-resolution end-of-life data for wholesale-channel product, the half of distribution from which the brand today has almost no visibility at all. The data is required as evidence under CSRD Scope 3 Category 12 for any brand reporting on end-of-life emissions, and under SBTi guidance for any brand committing to a Scope 3 target (SBTi Apparel Sector Guidance). The direct-to-consumer channel returns this data by default through the existing customer record. The wholesale channel does not.
Commercial value for the brand. Customer visibility in the wholesale channel that did not previously exist. Material composition, condition grade at return, and channel of return per product per customer, exposed to the brand as a Brand Intelligence subscription against a data layer the brand does not have to operate or own. The data exists because the retailer operates the take-back counter and the platform sits underneath it; the brand consumes the data as a downstream subscriber.
The failure mode this resolves. The wholesale-channel data gap is the largest single visibility problem for a multi-channel brand. The wholesale channel returns aggregate weight reports through the recycler's invoice and nothing else. CSRD does not accept weight reports as evidence for product-level reporting obligations. The data layer at the take-back counter is the only point in the wholesale chain where the brand can attach an identifier to a returned product without owning the retail relationship. The platform produces that attachment by recording the SKU at the moment the customer scans, before the product enters the downstream sort line.
Role: the downstream operator whose industrial unit economics depend on feedstock that is identified before it arrives. The recycler is the actor most distant from the customer in physical and informational terms, and the actor whose capital expenditure has been built to compensate for that distance.
Sustainability impact for the recycler. Industrial-scale textile-to-textile recycling becomes economically viable when feedstock is identified at the point of capture rather than after the sort. Sort yield improves. The four failure modes that kill recycler unit economics in communal collection (contamination from non-textile waste; miscategorisation of fibre composition; mass-mix unpredictability; unattributable provenance) are structurally absent at the retail counter, because each is resolved by the data captured at the moment of return. (The four-mode taxonomy is the author's, drawing on failure modes documented in [28] and [4].) MRF sort-line capex is the downstream cost of upstream information absence; identification at the point of return is a candidate for reallocating that capex, not for adding to it.
Commercial value for the recycler. Identified, condition-graded feedstock at the dock. Processing cost per tonne falls. The cost-per-kilogramme bid the recycler can make to a retail client becomes defensible against a cheaper bid from a competitor who is not also delivering the data layer, because the data layer reduces the recycler's own operating cost. The flat per-recycler platform fee is the only line on the recycler's invoice that converts into a competitive moat with the retailer.
The failure mode this resolves. The European build-out required to scale textile-to-textile recycling to a meaningful share of post-consumer volumes is estimated at €8 to €11 billion in capital expenditure plus €5 to €6.5 billion in recurring annual operating expenditure by 2035 [4]. Per-tonne sort cost on automated lines runs €150 to €280, against manual sort cost of €250 to €400 [29]. The 36 per cent communal sort yield is not a fact about textile waste; it is a fact about textile waste without identification at the point of return. That build-out funds the machinery to re-identify what should never have been lost. The textile-to-textile recycling EBIT margins running from minus 75 per cent to minus 25 per cent for polyester recyclers are the operating-line consequence of that capital commitment servicing a feedstock specification it was built to compensate for, not to receive.
Renewcell is the most documented European case of the failure mode. €200 million raised against a chemical recycling process that worked; bankruptcy in February 2024 because the feedstock did not arrive at the specification the offtake contract required; acquired by Altor in late 2024 with the operating model unresolved [50]; [40]. The recycling technology in Renewcell's plant worked. The information layer in front of the plant did not exist. The lesson is illustrative, not predictive: capacity is not a substitute for characterised feedstock, and the case puts in plain sight the unit economics that follow when the information gap is left in place. The JRC's 2024 work on the Digital Product Passport names the structural alternative: if composition travels with the garment, the sort line collapses from a re-identification machine into a routing machine [30]. The implication for the recycler's capex base is direct.
Each of the four stakeholders captures a sustainability impact and a commercial value from the same data event. The two channels travel together at every node, or they do not travel. A platform that produces sustainability impact without commercial value to the actor produces a compliance cost line a finance director will pressure-test out of the budget at the next planning cycle. A platform that produces commercial value without sustainability impact produces a transaction with no claim on the regulator's frameworks and no defensible attribution against the impact investor's diligence framework. The four-stakeholder framing is not a marketing arrangement of the value chain; it is the structural condition under which the impact thesis is operable at scale.
Five revenue streams from one data event. Five categories of impact attribution from the same row in the database.
The architectural claim of the platform is that one scan event in a retail store produces five distinct commercial revenue lines and five distinct categories of impact attribution simultaneously, from the same row in the database.
The five revenue streams are:
The five categories of impact attribution are:
The same metadata row supports each of the five impact attributions and each of the five revenue lines. This is the architectural difference between the in-store collection data layer and a single-channel platform. A recycling platform captures one impact category. A reverse-logistics platform captures one revenue line. A sustainability reporting platform captures one stakeholder. The data layer at the take-back counter captures all five of each, from one event, at the resolution the downstream frameworks consume.
The causal chain from the scan event to net impact has eight links. Each link has a stated relationship between input and output; an operational measurement that the platform produces today; a published peer-reviewed anchor that establishes the relationship in the literature; and, where relevant, an open empirical question that remains part of the platform's own research output over the next twenty-four months. The open questions are recapitulated in §8.
Relationship. The consumer population whose participation determines the upper bound on collection rate is heterogeneous, with three behaviourally distinct cohorts in approximately stable ratios across European retail contexts: prosocial (~18%), middle (~50%), indifferent (~32%).
Operational measurement today. The platform measures scan rates per store per week and customer repeat behaviour over rolling windows. Cohort attribution is inferred from the distribution of repeat-versus-first-time scans and from the distribution of capture rates across stores with comparable footfall.
Anchor. [1] for the cohort structure description; the companion paper [2] for empirical replication across the Dutch retail deployment.
Open question. Cohort-level attribution of participation at deployment scale: what proportion of captured emails come from the middle cohort versus the prosocial baseline, and what proportion of new participation is incremental to the existing batch system rather than a substitution from it. Resolved through deployment-variance analysis over the next twenty-four months.
Relationship. The drip-style return model converts the consumer ask from accumulation to in-flight return, reducing the cognitive cost of participation and recruiting the middle cohort that the batch model under-serves. The empirical signature is approximately 1.5 items per identified customer over a nine-month window, and approximately 27% of email-captured scans from repeat customers [2].
Operational measurement today. Per-customer item count over rolling time windows. Repeat-scan ratio per store per quarter.
Anchor. [31] on the information × rewards × convenience trinity in consumer returns behaviour. [49] on transparency-premium effects in consumer purchase decisions.
Open question. The drip-versus-batch differential in net collection rate at retailer scale: what proportion of in-flight scans are incremental rather than substitutive of the batch collection a customer would otherwise have performed.
Relationship. Scan rate at the store level is driven by four operational variables: incentive structure, QR prominence, frontline staff engagement, and the brand-mix-per-store. The brand-mix hypothesis (that captured product mix at a given store reflects existing market share at that store rather than platform bias) is testable at scale and is the platform's primary methodological control for downstream impact attribution.
Operational measurement today. Scan rate per store per week, decomposed against the four variables through deployment telemetry and partner-supplied store characteristics.
Anchor. Marketing-operations literature on point-of-sale signalling, summarised in [31].
Open question. Whether the brand-mix hypothesis holds at deployment scale across heterogeneous European retail formats. Resolved through deployment variance across the EU rollout under the 2028 EPR mandate.
Relationship. The reward offered at the scan event operates on a non-linear curve with a crowding-out zone in the lower-middle range, where a small extrinsic reward reduces participation among the prosocial cohort relative to no reward at all [51]. The platform's incentive design must avoid the crowding-out zone: small reward magnitudes that demotivate prosocial participants while not yet motivating the middle cohort.
Operational measurement today. Reward redemption rate per store per reward tier. Cohort-segmented response measured through repeat-scan distributions.
Anchor. [51] on the non-linear crowding-out zone in extrinsic rewards for prosocial behaviour.
Open question. The empirical location of the crowding-out zone in the specific context of in-store textile collection in European retail, a research question that the platform's deployment variance is the only at-scale instrument for answering.
Relationship. Four failure modes that kill recycler unit economics in communal collection are structurally absent at the retail counter: contamination from non-textile waste mixed into the collection bin; miscategorisation of fibre composition; mass-mix unpredictability; and unattributable provenance that prevents recall or quality dispute resolution. Each is resolved by the data captured at the moment of return: the customer hands the product to the counter, the AI identifies it, the SKU resolves the composition through the brand's published material data. The 36 per cent communal sort yield benchmark is not a fact about textile waste; it is a fact about textile waste without identification at the point of return. §3.4 and §4.4 develop the downstream capex consequence in full.
Operational measurement today. Per-scan SKU resolution rate (92% across deployment to date). Per-scan condition grade. Per-scan composition resolution through brand-supplied material data.
Anchor. [4] on the 36% sort yield baseline in communal collection. [52] on the environmental footprint of textile production at 17–25 kg CO2e per kg of garment, which establishes the upper-bound benefit available if feedstock can be characterised before sorting.
Open question. The sort-yield differential between identified and communal feedstock at downstream recycler scale. Resolved through downstream-partner lifecycle assessment scheduled for completion in 2026.
Relationship. Industrial-scale textile-to-textile recycling is feedstock-constrained, not capital-constrained or technology-constrained at the relevant horizon. Characterised feedstock is the precondition for the technology to operate at its rated throughput and yield. MRF capex of €15 million to €40 million per facility, with a cumulative European requirement estimated at €6 to €7 billion by 2030, is the price the chain is currently paying to compensate for the absent upstream identification (§4.4). Identification at the point of return is a substitute for that capex, not an addition to it. The Renewcell bankruptcy is the most public European example of the constraint being binding, with €200 million of capital deployed against a working chemical process that the feedstock specification could not service [50].
Operational measurement today. Volume of identified feedstock delivered to recycler partners per month. Composition mix of identified feedstock per recycler per quarter.
Anchor. [4] on textile-to-textile recycling EBIT margins at −75% to −25% for polyester recyclers and on the aggregate European sorting-infrastructure capital envelope. [40] on the Renewcell failure case.
Relationship. The net environmental impact per kilogramme of identified feedstock is the product of three quantities: sort yield (the proportion of input mass that exits the sort as usable recycled fibre), pathway-specific lifecycle CO2e (the emission footprint per kilogramme along the specific downstream pathway: fibre-to-fibre, mechanical, chemical), and the displacement factor (the proportion of the recycled output that displaces virgin material in downstream consumption rather than supplementing it).
This is the empirical question on which the entire circular business model proposition rests. Industry showcase cases for resale, repair, and refurbishment are typically presented at the growth-rate level, turnover, market share, share of group revenue, without engagement with the displacement question that determines whether the growth produces net environmental benefit or net throughput expansion. The platform's data layer at retail scale is the available research instrument for resolving the question. The open empirical question in §8.1 is not a limitation of the platform; it is the platform's largest single contribution to a question the industry has been describing without answering for a decade.
Operational measurement today. Sort yield through recycler partner. Pathway-specific lifecycle CO2e from published sector data [52]; [53]. Displacement factor estimate from the published rebound-effects literature [54]; [55].
Anchor. [54] for the conditional-on-displacement formulation of circular-economy GHG benefit (77–85% reduction). [53] for the reused-garment environmental-impact factor (approximately 70× less than equivalent new). [55] for the rebound-effects framing.
Open question. The displacement factor at retail scale, the binding parameter for net environmental benefit, and the platform's largest single open empirical question. Resolved through downstream-partner lifecycle assessment over the 2026–2027 horizon.
Relationship. Willing participation by a retailer compounds deployment quality in ways that compelled participation does not. A retailer who deploys because the take-back programme has become a marketing acquisition channel actively promotes the QR poster, trains staff to mention the programme at the counter, and treats scan-rate variance as a marketing metric. A retailer who deploys because the EPR mandate requires it does the minimum the mandate specifies. The deployment-quality differential between the two postures is large enough to shift cohort recruitment, store-level scan rate, and downstream sort yield: every variable in links 1 through 7.
Operational measurement today. Scan rate per store per week. Staff-mention rate per store, where available from partner telemetry. Internal marketing-team adoption of the platform metrics within retailer organisations.
Open question. The deployment-quality differential at scale, expressed as a scan-rate multiplier for willing-versus-compelled deployment. Inferred from the deployment-variance analysis under Link 3 over the EU rollout.
The platform reports six impact indicators, ranked in priority order by current operational verifiability rather than by marketing weight. The ranking is deliberate. The reader's eye lands on the strongest, most-defensible metric first; the indicators that depend on the displacement factor (the platform's largest open question) are reported in second tier with the dependency named in line.
Indicator 1: Waste diverted from disposal (kg). Category 3 Performance Indicator under the EU Categorisation System. Measured as the count of returned items at scan, converted to mass through retailer-supplied per-SKU mass data. Verification path: scan log audited against recycler weight bridge at receipt.
Indicator 2: Verified consumer engagement (emails captured; repeat rate). Performance and economic-value indicator. Measured as the count of validated email addresses captured at the scan event, plus the repeat-scan ratio across rolling windows. Verification path: email validation status logged at capture; repeat-scan ratio reconstructed from customer hash records.
Indicator 3: Per-product end-of-life events captured (brand-attributed). Compliance evidence indicator under CSRD Scope 3 Category 12, ESPR DPP, and EPR fee modulation. Measured as the count of per-SKU records exported to the retailer's evidence layer. Verification path: per-record export confirmation; SKU resolution rate audited against AI-identification confidence.
Indicator 4: Linear resource use avoided (tonnes). Headline Indicator under the Global Circularity Protocol (WBCSD/UNEP, COP30 November 2025). Calculated as diverted mass × displacement factor. Dependency on the displacement factor named in §8.1.
Indicator 5: GHG emissions avoided (tCO2e). Impact Indicator under the Global Circularity Protocol. Calculated as diverted mass × pathway-specific lifecycle CO2e × displacement factor. Dependencies on the pathway factor and the displacement factor named in §8.1 and §8.4.
Indicator 6: Additional indicators (water, hazardous waste, non-GHG pollutants). Calculated from BCG/ReHubs sector conversion rates against diverted mass. Dependency on sector conversion rates published by third parties named in line.
The ordering creates an honest reading hierarchy. The diligence reader who scans the indicator list first encounters three indicators where the verification path is direct and operational, and only then encounters the indicators where a published-literature parameter is in the multiplication. Each Tier 2 indicator is reported with its central estimate and the range that the parameter uncertainty implies.
Four empirical questions remain open at the time of publication. Each is presented here as a research output (what the platform will measure over the next twenty-four months, with the experimental design and the partner role identified), rather than as a gap.
The binding parameter for net environmental benefit. The displacement factor is the proportion of recycled output that replaces virgin material in downstream consumption rather than supplementing it; the published literature places it in a wide range, with a long history of the rebound-effects framing [54]; [55]. The conditional-on-displacement 77–85% GHG reduction is the central published anchor; the lower bound under hostile displacement assumptions is materially lower.
The platform is the at-scale research instrument for narrowing the range. Deployment data (what was diverted, where it went downstream, what fibre it became, into which product category that fibre re-entered) provides the input set that a downstream-partner lifecycle assessment can use to compute a measured displacement factor specific to European in-store retail collection. The first LCA pass is scoped for completion in 2026, with the platform's recycler partner.
The proportion of captured emails that come from each cohort, and the proportion of new participation that is incremental to the existing batch system rather than substituted from it. Resolved through deployment-variance analysis: store-by-store scan rates across stores with comparable footfall, decomposed against the four operational variables in Link 3, segmented by repeat-versus-first-time status, validated against partner CRM where the partner provides access. The next twelve months of European rollout produce enough variance for the decomposition to be statistically tractable.
Including the brand-mix hypothesis, that captured product mix at a given store reflects the existing market share of brands at that store rather than a platform-induced bias toward particular brands. The hypothesis matters for downstream impact attribution: if the capture mix is biased by the platform, then downstream impact figures need a correction term; if the capture mix is unbiased, the figures can be taken at face value. Resolved through the same deployment-variance analysis under §8.2, with the brand-mix decomposition adding a per-store comparison against retailer-supplied sell-through data.
The expected improvement in sort yield from identified versus communal feedstock at downstream recycler scale. The communal benchmark is 36% [4]; the platform's hypothesis is that identified feedstock improves this by a margin large enough to shift recycler unit economics. Resolved through partner LCA scheduled for 2026: sort yield measured on identified feedstock through the FastFeetGrinded line, compared against published communal benchmarks for matched fibre composition.
The four questions are not gaps. They are the research the platform is uniquely positioned to do, because the platform produces the deployment data the research requires. Each is named in the indicator architecture and in the theory-of-change links where it is binding. None is permitted to sit in a footnote where a diligence reader would have to find it.
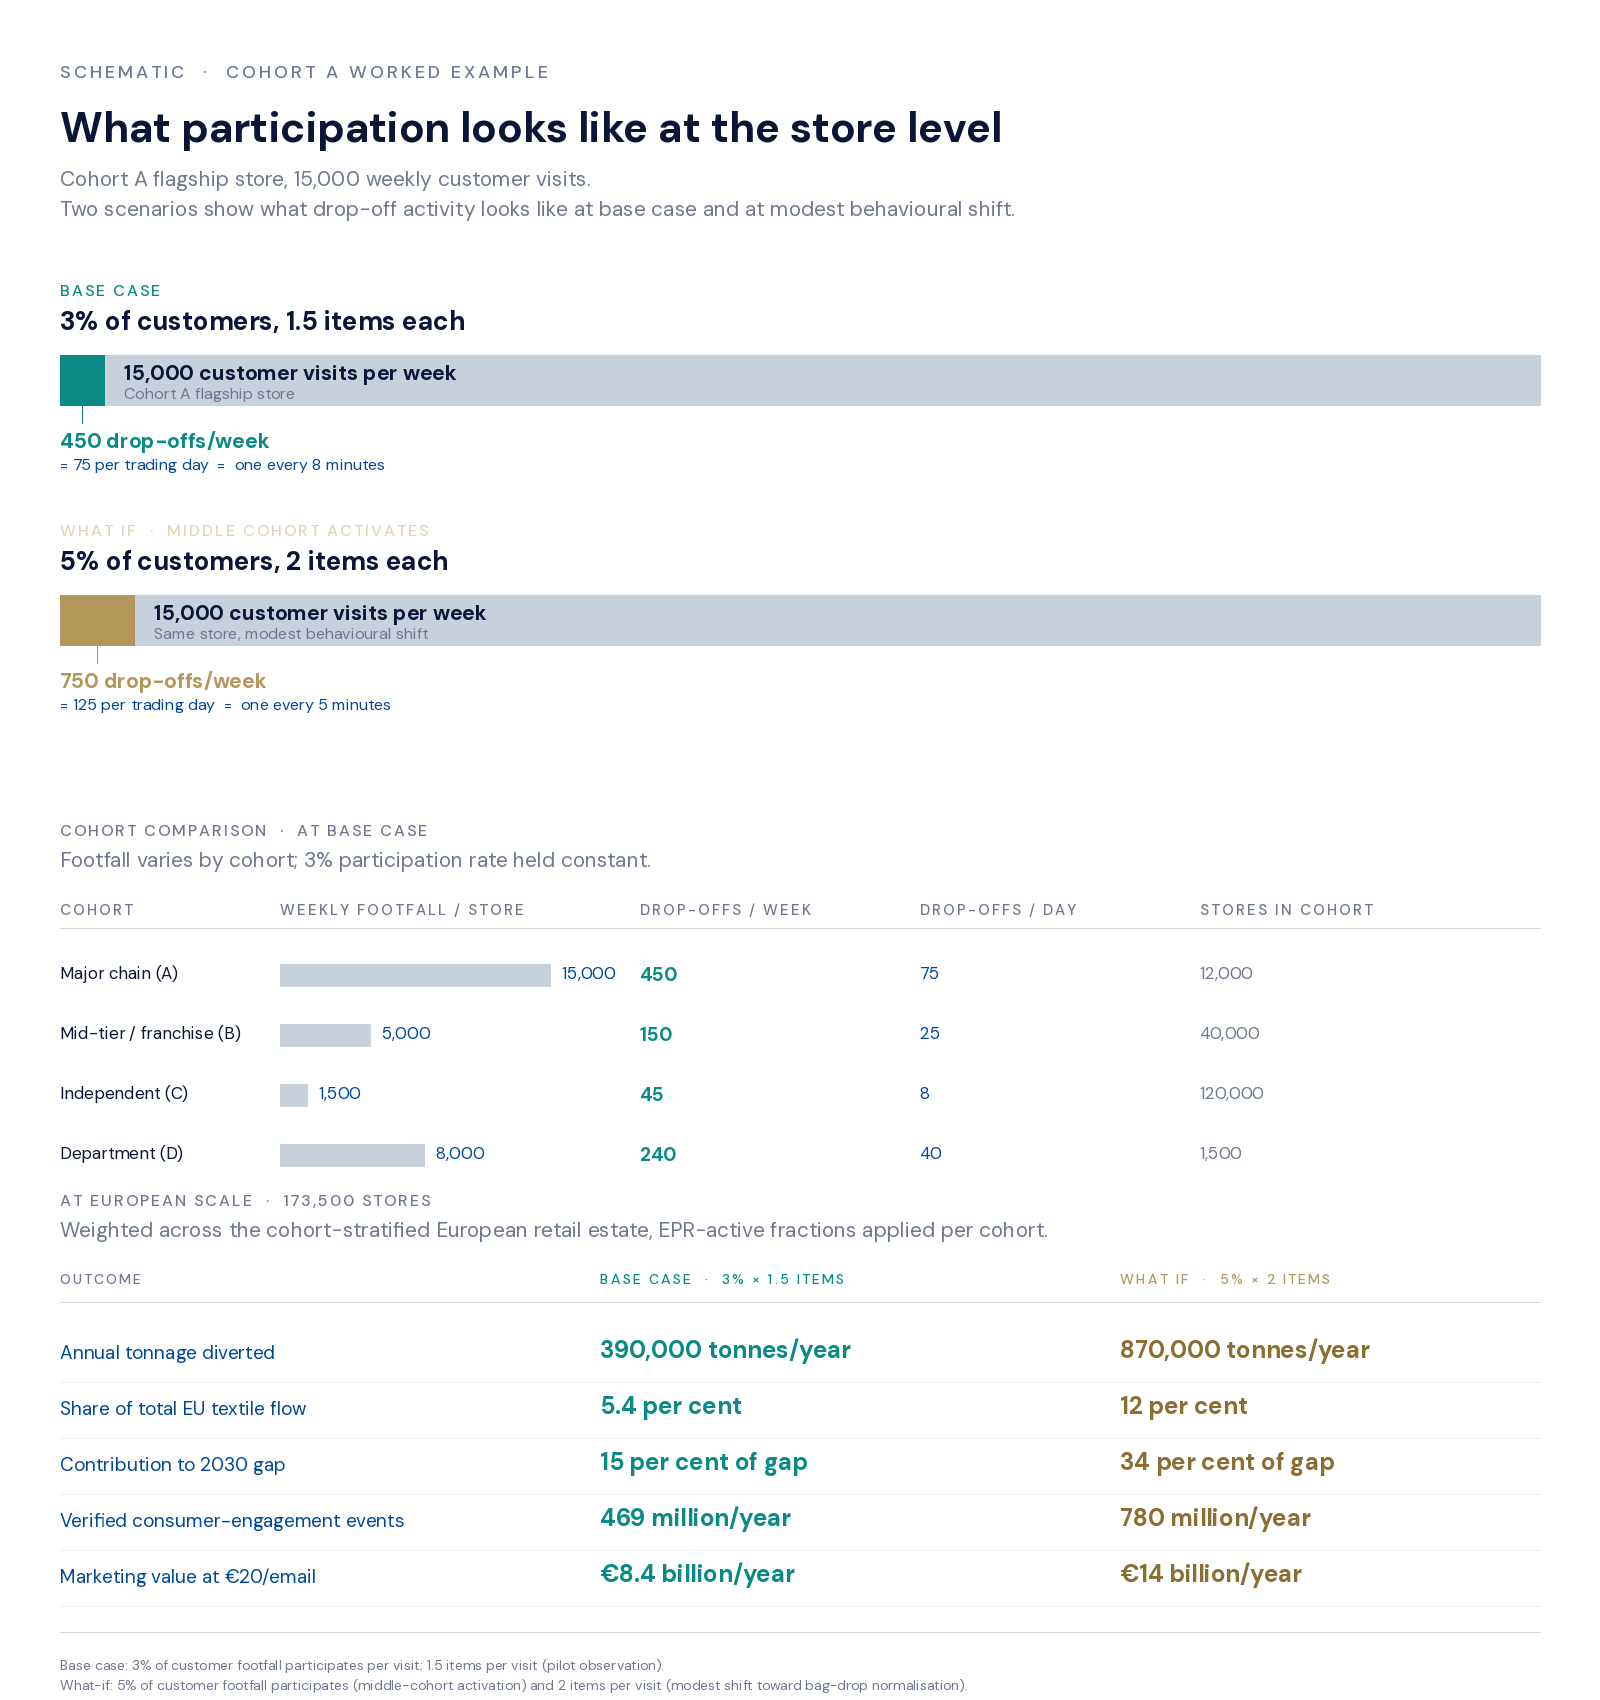
The Waste Framework Directive amendment [3] brings every large-format apparel, footwear, and sportswear retailer in the EU27 and EEA under an Extended Producer Responsibility obligation for textiles by 17 April 2028. The European retail estate subject to this mandate is heterogeneous. A flagship Inditex store in central Berlin and a single-location independent in a Dutch village are not the same operational unit. Treating them as equivalent, as the flat per-store extrapolation does, papers over distributional realities that determine what an at-scale impact figure actually means.
The cohort-stratified European retail estate comprises four operationally distinct cohorts:1
The prior flat extrapolation of approximately 100,000 stores corresponded to Cohorts A and B plus the higher-engagement portion of Cohorts C and D; the cohort-stratified model exposes the full retail estate at the layer of granularity the EPR mandate operates against, including the long-tail independent layer where take-back applicability varies by country threshold.
At cohort-stratified European steady state, operating at full-category coverage and replacement-cycle maturity:
Read against the sector denominator: European textile waste runs to approximately 7.2 million tonnes per year. The 390,000-tonne central figure is approximately 5.4 per cent of total flow. Read against the trajectory denominator (the gap between the current 14.7 per cent EU collection rate and the 50 per cent ambition the EU has set for 2030, requiring approximately 2.54 million tonnes per year of additional capture), the contribution is approximately 15 per cent of the gap. Retail take-back as a mechanism, deployed across the cohort-stratified estate at steady state, contributes approximately one-seventh of the gap to the 2030 ambition. The remaining six-sevenths must come from continued growth in municipal collection, charity channels, online return channels, and the ongoing collection-rate improvements driven by the directive's eco-modulation mechanism. Operating alongside those channels, not substituting for them, retail take-back at the cohort-stratified scale brings the new EU collection rate to approximately 19 per cent of total flow.
The structural claim is what survives the calibration. The flat extrapolation read as a forward operational projection from current deployment, which the pilot data does not yet support at the rates the projection required. The cohort-stratified figure is a structural claim about the scale at which retail take-back, as a mechanism, contributes to closing the gap, at the European retail estate operating at full deployment of the EPR mandate. The scale calculator on the landing page lets a reader pressure-test the central scenario against alternative behavioural-parameter assumptions.
The honest framing matters. A reader who encounters the achievement figures without the sector denominator can dismiss the platform as overstated. A reader who encounters the sector denominator without the achievement figures can dismiss the platform as immaterial. The achievement comes first because the achievement is what the platform produces; the denominator comes second because the denominator names the boundary of the claim. The order is deliberate.
Note 1. The cohort-stratified central scenario is built as the weighted sum across four operationally distinct cohorts. Store counts per cohort (Cohort A ~12,000; Cohort B ~40,000; Cohort C ~120,000; Cohort D ~1,500; aggregate ~173,500) are derived from Eurostat structural business statistics for NACE Rev 2 sectors G47.71 (retail sale of clothing in specialised stores), G47.72 (retail sale of footwear and leather goods in specialised stores), G47.51 (retail sale of textiles), and G47.64 (retail sale of sporting equipment in specialised stores) [57], cross-referenced against EuroCommerce structural data for the chain-versus-independent split and the long-tail share [58], and matched to major-chain annual reports for the Cohort A composition [32]; [33].
The model uses three classes of behavioural parameter, labelled by epistemic status. Observed: items per visit (1.5, from pilot data). Structural: average kg per item (0.5 kg blended midpoint across the EU textile mix, on the pilot's 0.7 kg per pair for footwear and 0.3 to 0.6 kg for mixed apparel categories); EPR-active fraction per cohort (Cohort A universally EPR-mandated; Cohort B largely mandated with country-level variation; Cohort C variable EPR exposure depending on country threshold and chain affiliation; Cohort D variable applicability by store format). Target-driven: take-back visits per store per day at steady state (Cohort A central value materially higher than the observed pilot rate of approximately 1.6 scans per day in high-throughput stores; the gap of approximately one to two orders of magnitude reflects three structural claims: full-category coverage multiplies the addressable rate by 5 to 10 times relative to the pilot's single-category footwear coverage; replacement-cycle maturity multiplies by 2 to 4 times relative to the pilot's partial nine-month window against the 9 to 18 month replacement cycle for running shoes; and Cohort A foot traffic supports the absolute rate the model uses for the cohort).
The 90 per cent capture rate observed in the pilot deployment is used in the verified-engagement-event scaling.
The CO2e arithmetic uses 7 kg CO2e per kg of garment at end-of-life as the textile-sector reference, drawing on the Niinimäki et al. (2020) production-footprint range of 17 to 25 kg CO2e per kg and the Sandin & Peters (2018) reuse-and-recycling impact-factor literature for the end-of-life calibration [52]; [53]. The central displacement factor of 0.65 sits inside the 0.5 to 0.9 range that the published rebound-effects literature places around the conditional-on-displacement parameter [54]; [55]; the displacement-factor uncertainty named in §8.1 is the largest single sensitivity in the model.
The sensitivity range (82,000 to 1.37 million tonnes per year) derives from plausible variation across the behavioural parameter set: visits per store per day at the cohort level, items per visit, kilogrammes per item, and EPR-active fraction per cohort. The low scenario reflects conservative assumptions on all four; the high scenario reflects upper-bound assumptions on all four and requires full European EPR-active rollout at parameters that have not been demonstrated at scale; the central scenario uses the model's working values across the parameter set.
Per-store rates are not disclosed at any granularity below the cohort aggregate, in line with the commercial-in-confidence commitment in the companion paper.
The platform's impact attribution maps against every framework an informed impact investor will already recognise. The alignment is across universally accepted, internationally recognised frameworks only, no fund-specific protocols, no named-investor frameworks. The list below names each framework, the platform's alignment position within it, and the evidence the platform produces against it.
EU Categorisation System for the Circular Economy. Category 3 (Re-use / value recovery), sub-category Traceability platforms. Category 4 (Enabling Technologies). Evidence: scan-event record, per-SKU resolution, downstream chain-of-custody (the chain-of-custody implementation is roadmap, not shipping, see §11).
Global Circularity Protocol (WBCSD/UNEP, launched at COP30 on 11 November 2025) [56]. Headline Indicator: linear resource use avoided. Impact Indicator: GHG emissions avoided. Performance Indicator: waste diverted from disposal. Each measurable from operational platform data, with the displacement-factor dependency named in §8.1.
IMP 5+1 Dimensions of Impact (Impact Management Platform). Aligned across what (Indicator 1: waste diverted; Indicator 5: GHG avoided), who (the four-stakeholder framing identifies the actors; Indicator 2: verified consumer engagement), how much (the §9 extrapolation provides the at-scale magnitude), contribution (the §8 displacement-factor analysis is the contribution-specific evidence), risk (the §11 honest pending items are the risk disclosure), and outcome over time (the §9 24-month research roadmap).
GIIN Core Characteristics of Impact Investing. Intentionality: the platform's commercial model embeds the impact attribution structurally rather than reporting it externally. Use of evidence: §6 of this paper. Management for performance: the indicator architecture in §7. Contribution to industry growth: the §8 research roadmap.
GIIN IRIS+ Indicators. OI4297 (waste recovery), PI7910 (CO2e avoided), PI3905 (number of stakeholders served). Each measurable from operational platform data.
Planetary Boundaries. The platform's impact is primarily in the land-system change and novel entities (chemical pollution) boundaries, through the diversion of textile waste from landfill and incineration. Secondary contribution to the climate change boundary via Indicator 5.
UN Sustainable Development Goals. Primary: SDG 12 (Responsible Consumption and Production), SDG 13 (Climate Action), SDG 15 (Life on Land). The mapping is direct through Indicators 1, 3, 5, and 6.
ESRS E5 (Resource Use and Circular Economy) under the Corporate Sustainability Reporting Directive. The platform produces the per-product end-of-life records that ESRS E5 disclosure requires from any retailer with downstream value-chain reporting obligations. Indicator 3 is the operational measurement.
GHG Protocol Scope 3 Category 12 (End-of-life treatment of sold products). The platform produces the per-product end-of-life records that Scope 3 Category 12 reporting requires for retailers and brands. Indicator 3 is the operational measurement; Indicator 5 is the resulting per-product CO2e attribution.
CTI v4.0 (Circular Transition Indicators). Aligned across the Circular Inflow, Circular Outflow, and Water Circularity dimensions through Indicators 1, 4, and 6. The platform supplies the data layer; the reporting framework is the retailer's CTI submission.
EU Taxonomy for Sustainable Activities. The platform's activity (operation of a circular-economy traceability platform) is eligible under the Taxonomy's Transition to a Circular Economy environmental objective. Alignment with the substantial-contribution criteria is documented through Indicators 1 and 3.
SFDR Principal Adverse Impacts (PAI). The platform's deployment in a retailer's value chain produces evidence against PAI indicators 13 (rate of accidents), 15 (GHG emissions), and the optional climate-and-environment PAI indicators 1 (emissions per output) and 7 (hazardous waste). The diligence-team mapping route is straightforward.
Operational mechanisms inside the buyer's finance function. The frameworks above are the disclosure standards; the mechanisms named here are the operational tools a CFO already uses or is preparing to use. Environmental P&L modelling at the Kering scale (a 58 per cent intensity reduction across the group between 2015 and 2023, measured at product-level resolution) [61]. Internal carbon pricing tied to product-level emission factors. Sustainability-adjusted hurdle rates for capital allocation decisions. Sustainability-linked finance terms that condition cost of capital on disclosed circular-economy outcomes. Each runs on the same per-event SKU-resolution substrate that the §7 indicator architecture produces. The CSO-CFO partnership that the industry literature describes as the next governance step requires data infrastructure that resolves at the product level [61]; the platform supplies the substrate.
The alignment is full-stack: every framework an SFDR fund or a CSRD-reporting retailer will already be familiar with maps directly onto the indicator architecture in §7. The platform does not require a new framework. The platform produces evidence against the frameworks that already exist.
Shipping today. The platform is operating in nine retail stores in the Netherlands as of May 2026, across Runnersworld, INTERSPORT, and EK Sport, with FastFeetGrinded as the downstream recycler partner. Three of the nine stores account for approximately 86 per cent of total scans. Operational metrics across August 2025 through 9 May 2026: 1,556 scans, 1,398 emails captured at a 90 per cent capture rate, 92 per cent AI product-identification accuracy, ~1.5 items per identified customer, ~27 per cent of email-captured scans from repeat customers, €2.72 cost per email captured [2]. The deployment covers footwear specifically; full-category coverage across apparel, footwear, and sportswear is the subject of the cohort-stratified scaling model in §9. The retailer-facing platform, the customer-facing scan-and-reward flow, the recycler-facing identified-feedstock dashboard, and the data-export layer for CSRD evidence are in production.
Roadmap, not shipping. The Product Journey Layer, the downstream chain-of-custody schema that records the per-product pathway from store to recycler to processed output and into the next product, is on the platform roadmap. It is not in production. The §9 attribution figures assume the chain-of-custody is in place; the figures are reported under that assumption, and the assumption is named here.
Pending. A formal third-party lifecycle assessment is scoped for completion in 2026 with FastFeetGrinded. The LCA is the instrument for narrowing the displacement-factor range named in §8.1. The platform's claims that depend on the displacement factor (Indicators 4 and 5, the CO2e figures in §9) are reported with the central estimate and the range; the range will narrow with LCA completion.
Certification. ISO 27001 information-security certification is in initiation phase, not in hand. The platform's data-handling architecture is designed against the ISO 27001 control framework and the certification audit is scheduled for completion within twelve months. The platform's claims about data security in retailer integration follow the design-stage architecture; the certified status will follow the audit.
The investigations underneath the at-scale argument surface three patterns that recur across the chain. They are presented here in the form they appear in the evidence, before any inference about what to do about them.
Directive (EU) 2025/1892 places the EPR obligation on the entity placing goods on the EU market under its own name, brand or trademark, irrespective of the selling technique used. The Commission's Impact Assessment ranked this design above municipal-led collection and above status-quo extension on the explicit logic that it internalises the cost of end-of-life in the entity placing product on the market (§1.1). The directive's eco-modulation clause scales fees with durability, reparability, and recyclability, which is operative only when the obligated party is also the design-controlling party.
The recycling industry's primary responses to the directive have framed retailers as actors to be coordinated to deliver flow into the recycling network, not as co-designers of the operating model. The trade-association statements ask for harmonised fees, clearer waste-versus-used definitions, and capital subsidy for sorting infrastructure. They do not ask how the retailer's operating system should be specified to produce the per-product data the eco-modulation signal requires. Two organisations have read the choice differently: the Ellen MacArthur Foundation, which names brands, retailers and online marketplaces as the responsibility-bearing tier; and EuroCommerce, which treats its members as the design point. Outside those two, the framing is unchanged. The regulator engaged retailers because retailers are the only actor in the textile chain that combines volume placement, brand control, design control, and consumer-interface. The industry has read this as a financing perimeter rather than as a design decision.
Customer engagement at the moment of return is structurally absent from two places where it would be expected to appear. It is absent from the retail store's operating system: not because the store has decided to ignore it, but because conventional take-back enters the operating system as a violating input. Unscheduled task time at the till and fitting room. Non-sellable inventory on the balance sheet. Footprint at sales-productivity rates. The store reads take-back as a category of input the system was not specified to absorb, and treats the customer at the bin as a delivery mechanism, not as a consenting individual (§4.2).
The same engagement is absent from the recycling chain's profit and loss. Recycler annual reports, PRO operating disclosures, and EPR scheme financial statements organise their accounts around per-tonne flows and per-tonne costs (§3.3). Customer-engagement revenue does not appear as a line on the recycler's P&L because it has never been a line that recyclers contract for. Marketing industry surveys, in turn, identify first-party data acquisition as the highest-priority retail capability investment and list every channel through which it is acquired, except take-back. Two industries have drawn their commercial boundaries such that the customer-value line at the take-back moment falls between them. Neither categorises it. The line is unowned.
The realistic capital cost of an in-store identification stack lands at €3,000 to €5,000 per store. The cost of an MRF sort line built to compensate for absent identification lands at €15 million to €40 million per facility, with cumulative European requirements estimated at €6 to €7 billion by 2030 (§2.1, §4.4). Two to three orders of magnitude. Smartphone NFC is native to approximately 94 per cent of devices in circulation globally; the marginal hardware cost of a smartphone-based read is zero when the device is already in hand. Tags at €0.04 to €0.10 per garment are borne upstream, not on the retailer's capex line.
If the hardware is moderate and largely already present, and the downstream capex required to compensate for the absence of upstream identification is two to three orders of magnitude larger, the binding constraint is not the hardware. It is the systemic integration around it: who tags at the point of manufacture and to what specification, who owns the link between the tag identifier and the customer identity, who routes the resulting event data downstream to recyclers and EPR schemes and Digital Product Passport registries, and who absorbs the operating-model overhead of running a returns desk that is no longer a returns desk. The capex envelope is the easy part. The integration is everything around it.
The three patterns are not separable. The industry-side reading failure (§12.1) leaves the operational layer between obligated party and recycler unbuilt; the absence of customer engagement from both operating systems (§12.2) is the consequence of that layer being unbuilt; the integration problem (§12.3) is the specification of what the unbuilt layer would have to do. A change at any one node is structurally linked to changes at the other two. The industry cannot read the regulator differently without also reading the customer-engagement line as in-scope, which requires the integration problem to be solved.
The reverse direction holds with the same force. Solving the integration problem without the industry reading the regulator's choice differently produces a deployed identification layer that is treated by the chain as a vendor-supplied data feed rather than as the operational layer the directive presupposes. Building the customer-engagement line without the integration that connects it to product specification produces a marketing channel disconnected from the eco-modulation signal that the directive requires it to feed back into. The patterns are linked because they are facets of one structural absence: the operational layer between obligated party and recycler that the directive sets the floor for and the industry has not yet built the ceiling on.
The thesis developed in §§1 to 12 has used textiles as the carrier. The structural argument it sets out, that an information layer at the moment of consumer return is the binding constraint on closing the gap between the current trajectory and the policy ambition, applies in the same form to other consumer product categories where producer responsibility plus retailer obligation is the legislative pattern. This section names where the argument extends and where it does not.
The textile case is the leading public case, not the only one. Portable batteries operate under Regulation (EU) 2023/1542 with retailer take-back obligations active since 18 August 2025; the regulation sets a 73 per cent collection-rate target by 31 December 2030 [60]. Small waste electrical and electronic equipment has been a retailer obligation under WEEE Directive 2012/19/EU since 2012; thirteen years in, the EU collection rate stood at 40.6 per cent in 2022 against a 65 per cent target, and the gap is widening rather than closing [1]. Disposable vapes were withdrawn from the UK retail estate in June 2025 under SI 2024/1006 [62]; the analogous Member-State decisions across the EU27 are scheduled or pending. The emerging Ecodesign for Sustainable Products Regulation delegated acts for mattresses, furniture, and tyres will extend the legislative pattern to further categories on a 2026 to 2028 horizon [45].
Across these categories, the same diagnosis appears. The infrastructure has been built. The activation layer at the moment of consumer decision has not. The WEEE case is the longest-running test. After thirteen years of mandated retailer take-back across the EU27, the system is sitting at 62 per cent of its target with the gap widening rather than closing. The legislative architecture alone, retailer obligation plus producer responsibility plus collection-target enforcement, has not closed the engagement gap. The drawer is not a holding pattern before recycling; for most households, it is the terminus.
The structural restatement is category-agnostic. The disposal moment is the moment that needs to be reached. The layer the platform builds is an engagement-and-incentivisation layer at the moment of consumer return. The data event is the same across categories; the impact vectors and the commercial vectors differ. The same per-event SKU-resolution record that satisfies textile CSRD Scope 3 Category 12 reporting also satisfies battery-side fire-safe routing evidence, small-WEEE per-product end-of-life attribution, and the ESPR Digital Product Passport end-of-life event log across whichever delegated act applies. One data substrate, multiple regulatory frameworks, multiple commercial value lines.
The argument is strongest where the regulatory mandate is operational, the category carries a fire-safety or producer-design vector that makes per-product identification structurally valuable to recyclers, the retail interaction is the moment of replacement purchase, and the average unit value at retail is high enough to support a meaningful incentive at the scan event. Textiles satisfies all four. Portable batteries satisfies three: regulation is operational ahead of textiles, the fire-safety vector is acute, the recycler-side value of identified feedstock is high, but the unit value at retail (a single AA battery, a phone battery replacement) is below the threshold where a meaningful scan-event incentive operates at typical retail margin.
The argument is weakest where the regulator has set a collection target but not engaged retailers as the operating actor, the category does not return through the retail channel that sold it, or the unit weight is too low for the per-tonne reverse-logistics economics to function. Small WEEE sits at the boundary. The retailer obligation is real but partial: large-format retailers above 400 m² accept very small items free of charge, but the operational layer between counter and recycler has not been built at the cohort-stratified scale that the textile directive's eco-modulation requirement will trigger. Thirteen years in, the 40.6 per cent collection rate is the empirical answer to what happens when the regulatory floor exists without the operational ceiling. The lesson is that the legislative architecture is necessary but not sufficient; the activation layer is the binding constraint.
The three levers that close the engagement gap are constant across categories: information at the point of decision, a reward at the moment of action, and convenience throughout the interaction. The textile case demonstrates the levers operating together. The WEEE case demonstrates the consequence of the levers being absent for thirteen years. The battery case is the next operational test, and the one this paper's data substrate is built to serve when retailers operationalise it.
Two impact vectors become structurally visible when the argument is read across categories, both of which carry back into the textile case in sharpened form.
Fire-safe routing for lithium-ion-containing categories. Lithium-ion batteries embedded in clothing (heated jackets, illuminated footwear, wearable electronics) and in small WEEE returned through retail counters generate fire losses estimated at £158 million per year in UK waste-management infrastructure alone [63]. The £27 million Aberdeen materials-recovery facility fire in October 2024, attributed to a lithium-ion battery in mixed waste, is the most documented single-event loss [63]. The insurance literature places aggregate lithium-ion-attributed facility-fire claims in the European waste sector in the high hundreds of millions of euros per year [64]. Per-product identification at the point of return is the operational mechanism that routes lithium-ion-containing items to fire-safe processing rather than into the general sort stream. The data event at the retail counter resolves the routing decision before the item enters the reverse-logistics chain. This is a category-specific impact vector that the textile-only reading of the impact thesis does not surface, and a commercial vector for retailers in categories where lithium-ion contamination is a current operational risk.
Per-SKU eco-modulation at product-design resolution. The textile directive's eco-modulation clause, which scales producer responsibility fees with durability, reparability, and recyclability, is operative only when the obligated party knows what was returned at SKU resolution. Across categories, the same requirement holds: the eco-modulation signal reaches back into product specification only if the per-product record exists. Without that record, eco-modulation defaults to category averages, which do not differentiate at the product-design level and therefore do not produce the design-incentive feedback loop the directive's choice of obligated party was constructed to produce. The data event at the retail counter is the structural precondition for eco-modulation operating as designed; the cross-category lens makes this precondition visible as a regulatory-architecture requirement rather than a textile-specific feature.
The platform's value architecture maps onto the CFO maturity progression that the industry literature describes as the next governance step: compliance evidence for risk-mitigators, EPR fee attribution for cost-optimisers, CRM and CBM signal for commercial-drivers, and the full multi-payer architecture for transformation-enablers [61]. The structural observation is that the same data event serves all four archetypes from one record.
Two limitations sit in plain sight. The paper does not claim that the platform deploys identically across the four categories; the deployment specifics, the retailer interface, the recycler partner, the EPR scheme integration, vary by category, and the development work to deploy in batteries or small WEEE at scale is not the same as the textile deployment that is shipping today. The paper also does not claim that the textile case is the largest in volume or value terms; portable batteries operate ahead of textiles in regulatory timing, and the small-WEEE installed base is materially larger by item count. The textile case is the leading public case because the directive is the most structurally legible, the deployment is shipping, and the cohort-stratified extrapolation has been calibrated against operational pilot data. The structural argument extends; the worked example is textiles for reasons of evidence, not of priority.
The European retail estate is about to collect more textile waste than it has ever collected. The infrastructure to receive returned product will exist by 2028, because Directive (EU) 2025/1892 requires it. The infrastructure to produce structured data about each return will not exist by 2028, unless someone installs it deliberately. The three patterns in §12 set out why: the regulator's choice is being read narrowly by the industry that should be operationalising it; the customer-value line that would fund the operational layer is unowned by both the industries that could own it; and the binding constraint on building the layer is not hardware cost but systemic integration.
The data layer at the take-back counter is what installs the operational ceiling on the directive's floor. The same scan event captures the customer's email at €1 to €3, the retailer's CSRD evidence at SKU resolution, the brand's wholesale-channel customer visibility, and the recycler's identified-feedstock pre-sort record, from one event, against the frameworks that the regulators and the impact investors have already converged on. The five revenue lines pay for the deployment; the five impact-attribution categories satisfy the measurement obligations. EPR is not a 1.1 per cent cost drag absorbed against the cost of goods sold; it is the regulatory infrastructure that converts sustainability data from a cost line into a revenue-enabling asset. The displacement-factor question that determines whether any circular business model produces net environmental benefit or net throughput expansion is answered, not asserted, by the data substrate the platform deploys. The structural argument set out across §§1 to 13 extends to other consumer product categories where producer responsibility plus retailer obligation is the legislative pattern; textiles is the leading public case, the most structurally legible, and the demonstrated wedge. At cohort-stratified European steady state, approximately 390,000 tonnes diverted per year, approximately 2.73 million tonnes CO2e avoided per year, approximately 469 million verified consumer-engagement events per year. Operating alongside continued growth in municipal, charity, and online collection channels, retail take-back at cohort-stratified European steady state contributes approximately 15 per cent of the gap to the EU's 2030 ambition. Not transformative at sector level. The first measurable contribution to closing the gap.
The thesis is not that the data layer is sufficient to close the gap. The thesis is that the data layer is necessary, and that the path from 15% to 50% in twenty-four years cannot be reconstructed from a trajectory that has improved at 0.72 percentage points per year for the last six. Closing the gap requires a step change. The step change requires the information layer in front of the rest of the system. The information layer requires the platform.
The four empirical questions in §8 are the platform's commitment to answering, with measured operational data, the parameters under which this thesis is true. They are named in plain sight because the thesis depends on their being true at the values the published anchors suggest.
There is a question Tim Lee, as the author, finds himself returning to after every conversation with a diligence team or a retail buyer or a recycler partner. The 2028 EPR mandate is a known unknown. The European retail estate will operate take-back programmes whether or not those programmes produce structured data. The choice is between a deployed mandate that produces a kilogram figure and a deployed mandate that produces a per-product record. The cost of producing the per-product record sits below the cost of paid customer acquisition the retailer is already paying. The technology to produce it is shipping in nine stores. The frameworks that consume it are converging at COP30 and ESRS E5 and IRIS+.
Why, then, is the default deployment posture for an EPR-mandated take-back programme, across the conversations I have had over the last twelve months, still a kilogram figure at the loading dock, rather than a per-product record at the counter? I do not have a clean answer. But I think it is the right question.
This paper builds on the empirical findings reported in the companion paper The take-back counter as a customer acquisition channel [2] (Lee, T., v2, May 2026), and on the platform deployment data produced in partnership with Runnersworld, INTERSPORT, EK Sport, and FastFeetGrinded over August 2025 through 9 May 2026. The author thanks the partner teams for their willingness to share operational data, and the academic anchors cited throughout for the published work the impact thesis rests on.
1. European Environment Agency. (2024). Management of used and waste textiles in Europe's circular economy. EEA Briefing 03/2024. eea.europa.eu/publications/management-of-us…; also Waste electrical and electronic equipment (WEEE) collection rate. eea.europa.eu/en/european-zero-pollution-da…
2. Lee, T. (2026). The take-back counter as a customer acquisition channel. Utilitarian Research, v2, May 2026. /research/take-back-counter-customer-acquisition/
3. European Parliament and Council. (2025). Directive (EU) 2025/1892 of 10 September 2025 amending Directive 2008/98/EC on waste, as regards textiles. OJ L 2025/1892, 26 September 2025. eur-lex.europa.eu/eli/dir/2025/1892/oj/eng
4. Boston Consulting Group and ReHubs. (2026). Austruy, E., Giraud, T., Manuelli, N., van de Kerkhof, R., Wiener, E., Wong, R., Sauvaget, M., and Hamidouche, Z. Advancing Textile Circularity in Europe: The Case for System-Level Scale-Up. BCG Publications, 23 March 2026. bcg.com/publications/2026/france-advanc…
5. Linklaters. (2025). Voskoboinikova, J., and Feijao, S. EU: Revised Waste Framework Directive to cater for food and textile waste published in the OJEU. Linklaters Sustainable Futures, October 2025. sustainablefutures.linklaters.com/post/102l7yl/eu-revised-waste…
6. European Commission. (2023). Commission Staff Working Document, Impact Assessment Report SWD(2023) 421 final, Part 1, 5 July 2023. environment.ec.europa.eu/document/download/2f6d95b0-7a…
7. FEAD, EuRIC Textiles and Decathlon. (2024). Joint Position on Effective EPR Schemes in the Revised Waste Framework Directive. November 2024. fead.be/position/fead-euric-textiles-…
8. EURATEX. (2022). White Paper: EPR for Textiles, Laying the Pathway to Harmonisation. September 2022. euratex.eu/wp-content/uploads/EPR-White-…
9. Ellen MacArthur Foundation. (2024). Pushing the Boundaries of EPR Policy for Textiles. content.ellenmacarthurfoundation.org/m/25149f10b584fe49/original/P…
10. EuroCommerce. (2025). Position Paper on the Revised Waste Framework Directive – Textile Waste. 5 September 2025. eurocommerce.eu/app/uploads/2025/09/20250905-…
11. Zebra Technologies. (2023). RFD8500 Bluetooth Handheld UHF RFID Sled product page and RFD40 successor specification. zebra.com/
12. HID Global. (2024). TSL 1128 Bluetooth Technology UHF Terminal product page. hidglobal.com/products/tsl1128
13. Apple Inc. (2020). Core NFC framework documentation. developer.apple.com/documentation/corenfc
14. European Commission. (2024). Antitrust decision on Apple's mobile wallet practices, case AT.40452. competition-cases.ec.europa.eu/cases/AT.40452
15. IDTechEx. (2024). Near Field Communication (NFC) market report, smartphone NFC penetration analysis. idtechex.com/
16. CPCON Group. (2024). How Much Do RFID Tags Cost? 2024–2026 Pricing by Type. cpcongroup.com/insights/article/rfid-chip-co…
17. Spectroscopy Europe. (2023). Handheld NIR spectroscopy for textile identification, product review. spectroscopyeurope.com/product/handheld-nir-spectros…
18. Boston Consulting Group and Fashion for Good. (2022). Sorting for Circularity Europe. bcg.com/publications/2022/sorting-for…
19. Refashion. (2024). 2024 Activity Report and Rapport d'activité 2023. pro.refashion.fr/en/news/filiere/refashion-act…; refashion.fr/pro/sites/default/files/rappo…
20. Data and Marketing Association UK. (2023). Marketer Email Tracker 2023. dma.org.uk/research/marketer-email-track…
21. Klaviyo. (2024). 2024 Marketing Benchmarks for Apparel and Accessories. klaviyo.com/marketing-resources/benchmark…
22. Litmus. (2022). 2022 State of Email Report. litmus.com/resources/state-of-email-repo…
23. Gartner. (2023). CMO Spend and Strategy Survey 2023. gartner.com/en/marketing/research/annual-…
24. Forrester Research. (2024). The State of Retail Marketing, 2024. forrester.com/report/the-state-of-retail-ma…
25. Insider Intelligence/eMarketer. (2024). US Retail First-Party Data 2024. insiderintelligence.com/content/us-retail-first-party…
26. I:Collect and SOEX Group. (2023). Company information and process disclosures. ico-spirit.com/en/about/
27. FEAD (European Waste Management Association). (2023). Annual Report 2023, textiles chapter. fead.be/publications/
28. Joint Research Centre. (2021). Köhler, A., Watson, D., Trzepacz, S., Löw, C., Liu, R., Danneck, J., Konstantas, A., Donatello, S. and Faraca, G. Circular Economy Perspectives in the EU Textile Sector. JRC Publications Office. publications.jrc.ec.europa.eu/repository/handle/JRC125110
29. Tomra Recycling. (2023). Sorting textiles: technology and case studies. tomra.com/en/waste-metal-recycling/medi…
30. Joint Research Centre. (2024). Digital Product Passport: methodological and policy considerations for textiles. publications.jrc.ec.europa.eu/repository/handle/JRC135598
31. McKie, E. C., Sáez de Tejada Cuenca, A., and Agrawal, V. (2025). The information, rewards, and convenience trinity in consumer product-return behaviour. Manufacturing & Service Operations Management. doi.org/10.1287/msom.2023.0561
32. H&M Group. (2024). Annual and Sustainability Report 2024. hmgroup.com/wp-content/uploads/2025/01/HM…
33. Inditex. (2024). Annual Report 2024. inditex.com/itxcomweb/api/media/82d3a9d4-…
34. Deloitte Touche Tohmatsu. (2024). Global Powers of Retailing 2024. www2.deloitte.com/content/dam/Deloitte/global/D…
35. McKinsey & Company. (2023). State of the Retail Worker. mckinsey.com/industries/retail/our-insight…
36. NRF Foundation. (2022). Retail labour productivity and workforce research. nrffoundation.org/research
37. Cushman & Wakefield. (2024). Main Streets Across the World 2024. cushwake.cld.bz/Main-Streets-Across-the-World…
38. Savills plc. (2024). European Retail: Spotlight on Format Economics 2024. savills.com/research_articles/255800/3600…
39. Tan, T. F., and Netessine, S. (2014). When does the devil make work? An empirical study of the impact of workload on worker productivity. Management Science, 60(6), 1574–1593. doi.org/10.1287/mnsc.2013.1842
40. Sourcing Journal. (2024). SOEX, I:CO Textile Recycler Files for Insolvency. October 2024. sourcingjournal.com/sustainability/sustainability…; Friedman, A., Renewcell Bankruptcy: What Happened to Circulose. February 2024. sourcingjournal.com/topics/raw-materials/renewcel…
41. Changing Markets Foundation. (2023). Take-back Trickery: An investigation into clothing take-back schemes. June 2023. changingmarkets.org/wp-content/uploads/2023/06/TA…
42. Greenpeace Germany. (2022). Recycling-Mythen: Was passiert mit Altkleidern aus Sammelboxen? greenpeace.de/publikationen/Greenpeace_Deto…
43. VF Corporation. (2023). Annual Report on Form 10-K, fiscal year 2023. vfc.com/investors/financial-informati…
44. European Union. (2023). Commission Delegated Regulation (EU) 2023/2772 on sustainability reporting standards (ESRS). Official Journal L 2023/2772. eur-lex.europa.eu/eli/dir_del/2023/2772/oj
45. European Union. (2024). Regulation (EU) 2024/1781 of 13 June 2024 establishing a framework for the setting of ecodesign requirements for sustainable products (ESPR). Official Journal L 2024/1781. eur-lex.europa.eu/eli/reg/2024/1781/oj
46. DMA and Litmus. (2024). Marketer email tracker 2024. Data and Marketing Association, London. dma.org.uk/research
47. Opensend. (2025). State of email acquisition 2025. Opensend Research Report. opensend.com/state-of-email-acquisition
48. WordStream. (2025). Social media CPM and CPA benchmarks 2025. WordStream Research. wordstream.com/blog/social-media-cpm-benchma…
49. Buell, R. W., and Kalkanci, B. (2021). How transparency into internal and external responsibility initiatives influences consumer choice. Management Science, 67(2), 932–950. doi.org/10.1287/mnsc.2020.3589
50. Fashion Dive. (2024). Renewcell files for bankruptcy after struggling to find buyers for its Circulose pulp. February 2024. fashiondive.com/news/renewcell-bankruptcy-cir…
51. Wollbrant, C. E., Knutsson, M., and Martinsson, P. (2022). Extrinsic rewards crowd out moral motivation in a real-effort field experiment. Nature Human Behaviour, 6, 774–781. doi.org/10.1038/s41562-022-01302-0
52. Niinimäki, K., Peters, G., Dahlbo, H., Perry, P., Rissanen, T., and Gwilt, A. (2020). The environmental price of fast fashion. Nature Reviews Earth & Environment, 1, 189–200. doi.org/10.1038/s43017-020-0039-9
53. Sandin, G., and Peters, G. M. (2018). Environmental impact of textile reuse and recycling: a review. Journal of Cleaner Production, 184, 353–365. doi.org/10.1016/j.jclepro.2018.02.266
54. Wiedmann, T., Lenzen, M., Keyßer, L. T., and Steinberger, J. K. (2019). Scientists' warning on affluence. Nature Communications, 10, 1707. doi.org/10.1038/s41467-019-09714-9
55. Zink, T., and Geyer, R. (2017). Circular economy rebound. Journal of Industrial Ecology, 21(3), 593–602. doi.org/10.1111/jiec.12545
56. WBCSD and UNEP. (2025). Global Circularity Protocol for Business. Launched at COP30, 11 November 2025. wbcsd.org/actions/global-circularity-pr…
57. Eurostat. (2024). Structural business statistics by NACE Rev. 2 activity, dataset sbs_na_dt_r2; complemented by Number of enterprises by size class, NACE Rev. 2. Brussels: Eurostat. Used for store counts across NACE codes G47.71 (retail sale of clothing in specialised stores), G47.72 (retail sale of footwear and leather goods in specialised stores), G47.51 (retail sale of textiles in specialised stores), and G47.64 (retail sale of sporting equipment in specialised stores). ec.europa.eu/eurostat/web/structural-business-statistics
58. EuroCommerce. (2021). The Value of European Retail. EuroCommerce factbook, full data edition. Used for the chain-versus-independent split and the share of micro-enterprises in the European retail estate. eurocommerce.eu/the-value-of-european-retail
59. Government of the Netherlands. (2023). Beleidsprogramma Circulair Textiel 2025-2030. Ministry of Infrastructure and Water Management, July 2023. rijksoverheid.nl/onderwerpen/circulaire-eco…
60. European Parliament and Council. (2023). Regulation (EU) 2023/1542 of 12 July 2023 concerning batteries and waste batteries. OJ L 191, 28 July 2023. eur-lex.europa.eu/eli/reg/2023/1542/oj
61. Global Fashion Agenda and Boston Consulting Group. (2026). Fashion CFO Agenda 2026: From Cost Centre to Value Driver. GFA / BCG publication, May 2026. globalfashionagenda.com/research/cfo-agenda-2026
62. United Kingdom Government. (2024). The Environmental Protection (Single-use Vapes) (England) Regulations 2024 (SI 2024/1006). Department for Environment, Food and Rural Affairs. legislation.gov.uk/uksi/2024/1006
63. Eunomia Research & Consulting. (2024). Cutting Lithium-ion Battery Fires in the Waste Industry: Annual Costs and Mitigation Pathways for the UK. Report commissioned by the Environmental Services Association, October 2024. eunomia.eco/reports/cutting-lithium-ion-…
64. Allianz Commercial and RISC Authority. (2024). Lithium-ion Battery Fires: Risk Analysis for European Waste-Sector Insurance. Joint analysis, Allianz Commercial Risk Bulletin, 2024. commercial.allianz.com/news-and-insights/expert-…
One conversation. We'll walk you through the data, the deployment, and the unit economics for your specific footprint.
Book a call →